


Q4 Earnings Recovery, Macro Signals, and What the Markets Are Telling Us


In Brief: The May 2026 edition of Market Views covers three key themes — the early picture from India's Q4FY26 earnings season, a set of macro indicators spanning GST collections, auto retail sales, non-food credit growth, and crude oil prices, and a pointed analysis of what sectoral index behaviour in March and April 2026 is collectively signalling about where future market leadership may lie. Hiren Ved, Director and CIO, Alchemy Capital Management, presents the data and offers his perspective on each.
Q4FY26 Result Updates: Double-Digit Earnings Growth Returns
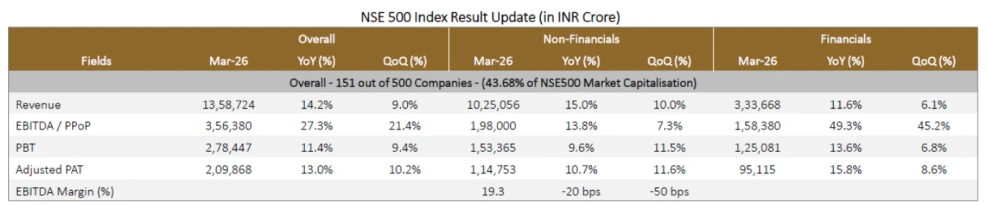
The Q4FY26 earnings season is underway, with 151 out of 500 companies representing approximately 44% of NSE 500 market capitalisation having declared results as of May 3, 2026, the initial trends are meaningful.
For the first time in several quarters, topline growth has moved decisively into double digits. Revenue growth across the NSE 500 universe stands at 14.2% year-on-year, while adjusted PAT growth is 13.0%. This is a notable shift from the pattern of the last several quarters, where topline growth had been largely confined to single digits. The uptick in revenue growth to the mid-teens could reflect a genuine recovery in volumes or, in part, the pass-through of price increases and inflation, a distinction worth monitoring as more companies report.
On the profitability side, EBITDA/PPoP growth across the NSE 500 was a strong 27.3% year-on-year, though EBITDA margins for Non-Financials came in at 19.3%—a modest compression of 20 basis points year-on-year and 50 basis points sequentially.
Source: Yes Securities | Note: Data as on May 03, 2026
Large Caps: Revenue Recovery, But Earnings Growth Still in Single Digits
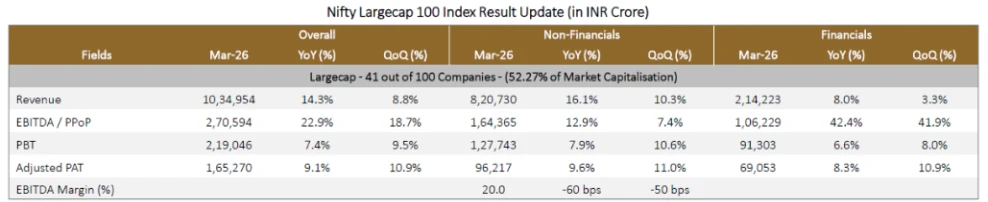
Among large caps, 41 out of 100 companies, representing 52.27% of large-cap market capitalisation, had reported till May 3, 2026. Revenue growth at the large-cap level is 14.3% year-on-year, in line with the broader market. However, as has been the trend for several quarters, large-cap earnings growth remains in single digits at 9.1% adjusted PAT growth. EBITDA margins for Non-Financials stood at 20.0%, compressing by 60 basis points year-on-year and 50 basis points sequentially.
Source: Yes Securities | Note: Data as on May 03, 2026
Midcaps: The Pace-Setters, With a Caveat
Midcaps continue to be the headline performers. Of the 150 midcap companies, 40 had reported, representing 26.57% of midcap market capitalisation. Revenue growth is 18.5% year-on-year, and adjusted PAT growth is 33.8%. However, an important caveat applies here: a significant portion of the profit swing has come from the financials segment within midcaps. One particular midcap bank reported a substantial turnaround, having booked heavy losses in the corresponding quarter last year due to significant provisions; it has now returned to profitability. This base effect has meaningfully inflated the headline midcap earnings growth number. Stripping out this effect, Non-Financial midcap topline growth is a more measured 16.4%, with Non-Financial adjusted PAT growth of 8.5%.

Source: Yes Securities | Note: Data as on May 03, 2026
Small Caps: Margin Story More Impressive Than Revenue
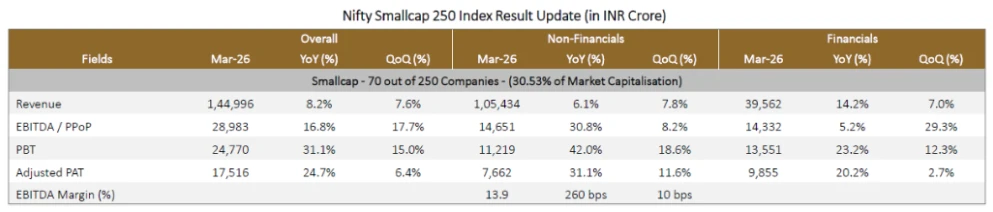
Revenue growth is the softest of all market cap segments at 8.2% year-on-year, firmly in single digits. However, the profit story is considerably stronger, with adjusted PAT growth of 24.7%. The EBITDA margin for Non-Financials in the small-cap segment has expanded by 260 basis points year-on-year to 13.9%, making this a notable margin-improvement story rather than a volume-driven one. Non-Financial small cap Adjusted PAT growth was a strong 31.1%, and Financial Adjusted PAT growth came in at 20.2%.
Source: Yes Securities | Note: Data as on May 03, 2026
Earnings Summary
Taking a step back across all market cap segments, two or three things stand out from the early Q4FY26 data (as of May 3, 2026). First, after several quarters of single-digit topline growth, revenue growth is now comfortably in mid-teens for both large and midcaps. Second, overall profitability is also growing in mid-teens. Third, the pecking order in terms of earnings momentum continues — midcaps lead, followed by small caps, and then large caps.
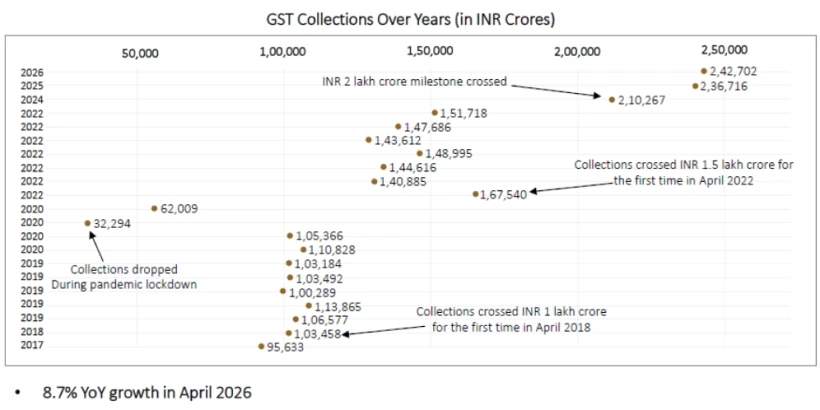
However, the absolute record number warrants a closer read. The 8.7% year-on-year growth in April 2026 broadly mirrors nominal GDP growth. More importantly, a significant portion of the growth in April 2026 collections has been driven by import duties, likely reflecting the impact of rupee depreciation rather than broad-based domestic consumption expansion. GST from domestic sales, which more closely reflects actual economic activity, remains broadly flat, partly because the base effect of GST rate cuts in earlier periods continues to weigh on the domestic revenue line. The headline number is a milestone, but the composition of growth is something worth watching carefully.
Auto Retail Sales: Sustained Momentum, with an EV Inflection
Auto retail sales held up well in April 2026, even as expectations were for some moderation given rising oil prices driven by the ongoing Iran-US conflict in the Middle East.
Passenger Vehicle retail volume grew 12% year-on-year in April 2026. Two-Wheeler ICE (Internal Combustion Engine) sales grew 13%. Commercial Vehicles delivered a strong 16% growth. But the standout data point of the month was Two-Wheeler Electric Vehicle sales, which grew at 61% year-on-year in April’26 — coming on top of 45% growth in March 2026.

Non-Food Credit Growth: A 12-Month High
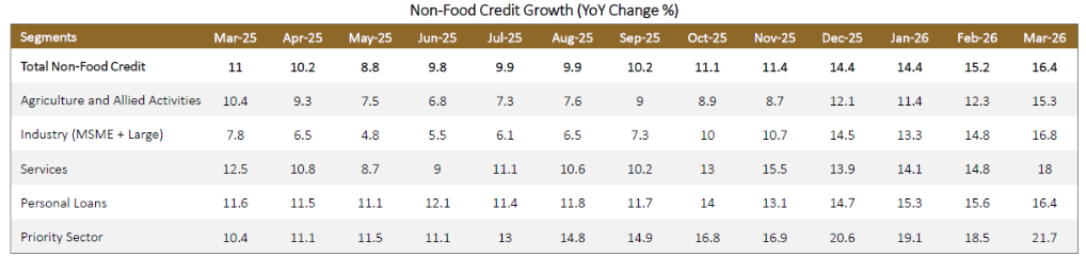
Non-food credit growth in March 2026, came in at 16.4% year-on-year, a 12-month high. Total non-food credit growth has been picking up steadily through the back half of FY26, rising from around 10.2% in September 2025 to 16.4% in March 2026.
Among the sub-segments, Priority Sector credit growth was the strongest at 21.7% in March 2026. Services credit grew 18%, Industry (MSME + Large) grew 16.8%, and Personal Loans grew 16.4%. Agriculture and Allied Activities grew 15.3%.
Source: Kotak Institutional Equities
Strong credit growth across sectors, particularly in industry and services, reflects a improving momentum for economic activity in our view.
Crude Oil Prices: The Dominant Macro Concern
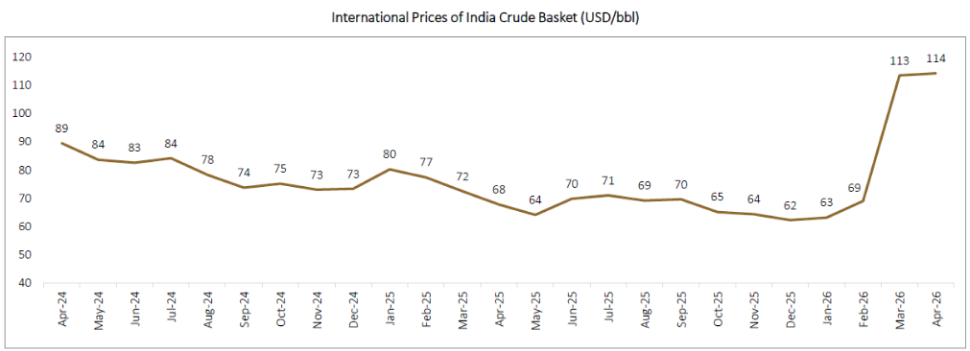
One of the worrying macro variables as of May 2026 remains energy prices. India's crude basket, which was averaging approximately USD 62 to USD 63 per barrel before the Iran-US war broke out, has risen sharply to approximately USD 113 to USD 114 per barrel
What Are the Markets Telling Us? Sectoral Index Returns — March and April 2026
The question posed is a simple one: When markets fall sharply and then recover, what is the relative performance of sectors, which sectors fell less, which fell more, which bounced the hardest, collectively tell us about where future market leadership might emerge?
March 2026: The Correction
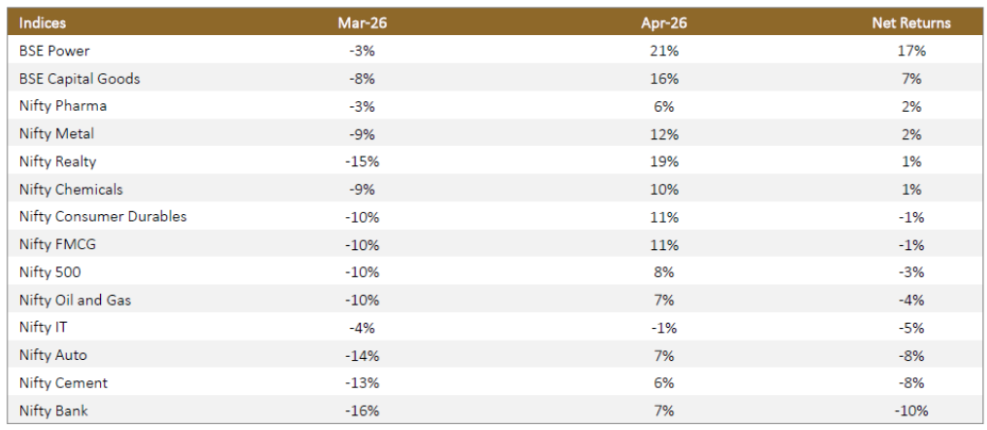
Following the outbreak of the Iran-US war at the end of February 2026, Indian markets corrected sharply in March 2026. The Nifty 500 fell approximately 10% for the month. The laggards were the sectors most sensitive to interest rates and economic sentiment: Nifty Bank was down 16%, Nifty Realty was down 15%, and Nifty Auto was down 14%. A sudden, sharp spike in crude oil prices would fuel inflation, which would in turn push interest rates higher, making rate-sensitive sectors disproportionately vulnerable, in our view
The relative outperformers in the March 2026 correction were BSE Power (down only 3%), Nifty Pharma (down 3%), and Nifty IT (down 4%). The resilience of pharma and IT was partly explained by the rupee depreciation that accompanied the crude oil spike; both are significant exporters and benefit from a weaker rupee.
April 2026: The Recovery
In April 2026, the Nifty 500 bounced back by 8%, partially retracing the March 2026 decline. The sectors that led the recovery were notably different from those that had merely held up during the fall. BSE Power surged 21%, Nifty Realty recovered 19%, and BSE Capital Goods rose 16%.
Sectoral Index Returns — Contributors and Laggards
Source: Nifty Indices — https://www.niftyindices.com/reports/historical-data | BSE Indices — www.investing.com
Among sectoral indices, the BSE Power index stood out with a net return of +17%. BSE Capital Goods comes in second at +7%, followed by a tie between Nifty Pharma and Nifty Metal at +2% each.
At the bottom, Nifty Bank (-10%), Nifty Cement (-8%), and Nifty Auto (-8%) were the laggards.
Decoding the Market's Message
The outsized net outperformance of Power and Capital Goods is not coincidental. Three interconnected themes explain it.
First, India is entering a strong summer season. Higher temperatures generally drive a significant spike in power consumption, making near-term demand a near certainty.
Second, and more structurally, the market appears to be pricing in a long-term strategic consequence of elevated crude oil prices: the accelerated electrification of India's economy. As crude oil prices rise, the economic imperative to shift energy consumption from imported fossil fuels to domestically generated electricity strengthens. More electrification generally drives more demand for power generation, transmission, and distribution.
Third, the Power sector is increasingly seen as an indirect beneficiary of the global AI capex cycle. Data centres, which require enormous and growing amounts of electricity, are one of the fastest-growing drivers of power demand both globally and in India. The market appears to be connecting these dots: Power is simultaneously a domestic demand story, an electrification story, and an AI infrastructure story.
Capital Goods follows closely and, for a related reason, a large component of the Capital Goods index comprises companies involved in power capex: transmission and distribution equipment and backup power systems. The strong re-rating of Power has naturally pulled Capital Goods along.
Pharma and Metals represent another market signal: Pharma as a beneficiary of rupee depreciation, and metals as a potential early indicator of infrastructure and industrial activity picking up.
The continued underperformance of Banks, Cement, and Autos, all deeply interest-rate-sensitive and domestically oriented, suggests the market has not yet fully priced in the resolution of inflationary pressures stemming from higher crude prices. These sectors remain on watch.
Putting It Together
The May 2026 Market Views presents a picture that is simultaneously encouraging and cautious. On the earnings side, the early Q4FY26 data show a genuine improvement: Double-digit revenue growth is back, profitability is recovering, and small caps, in particular, are showing impressive margin expansion. On the macro side, GST collections are at a record high, auto sales are holding up, and credit growth has hit a 12-month high, all of which reflect an economy on solid footing before the geopolitical disruption struck.
The dominant risk variable remains crude oil. India's crude basket at USD 113-114 per barrel represents a materially changed operating environment for corporate India. The Q4FY26 numbers are expected to be relatively clean, but Q1FY27 will be the true test of how effectively companies manage this cost shock. The resolution of the Strait of Hormuz situation and any normalisation of oil prices will be the most important external catalyst to watch.
Frequently Asked Questions (FAQs)
1. What were the key highlights from Q4FY26 earnings so far?
Based on data available as of May 3, 2026 (151 out of 500 companies having reported), NSE 500 revenue grew 14.2% year-on-year and adjusted PAT grew 13.0%. After several quarters of single-digit topline growth, mid-teens revenue growth represents a meaningful improvement. Large caps delivered 9.1% PAT growth; midcaps showed 33.8% PAT growth (inflated by a one-time financial sector turnaround); and small caps delivered 24.7% PAT growth, with a notable 260 bps EBITDA margin expansion.
2. What does the record GST collection in April 2026 indicate?
April 2026 GST collections of INR 2,42,702 crore were a new all-time record, reflecting 8.7% year-on-year growth. However, the composition matters—a significant portion of the growth came from import duties, likely reflecting rupee depreciation. GST from domestic sales remains broadly flat. The headline number is positive, but the underlying domestic consumption signal is more muted.
3. Why did Two-Wheeler EV sales grow 61% in April 2026?
Two-Wheeler Electric Vehicle retail sales grew 61% year-on-year in April 2026, following 45% growth in March 2026. Consumers appear to be anticipating future fuel price increases and hedging their running costs by switching to electric — an acceleration that may reflect a structural shift in EV adoption, particularly for two-wheelers, three-wheelers, and passenger cars.
4. Why did BSE Power outperform all other sectors on a net basis for March-April 2026?
BSE Power delivered net returns of +17% across March and April 2026, far outperforming the Nifty 500's net return of -3%. Three factors explain this: near-term seasonal demand driven by the summer season, a longer-term strategic expectation that rising crude oil prices will accelerate the electrification of the Indian economy, and the growing recognition of power as a key enabler of the global AI data centre capex cycle.
5. Which sectors were the biggest net laggards in March-April 2026?
Nifty Bank (-10%), Nifty Cement (-8%), and Nifty Auto (-8%) were the weakest performers on a net basis across March and April. All three are interest-rate-sensitive sectors, and the market appears to be pricing in the risk that elevated crude oil prices will sustain inflationary pressure and keep interest rates higher for longer.
Disclaimer:
This blog is for informational purposes only and should not be considered an offer or solicitation to buy or sell any securities or make any investments. We recommend readers take independent advice before making any investment decisions. Please refer to our Disclaimer and Disclosures for more details.