April 2026 Market Views: Geopolitical Shocks, Energy Prices, and Their Impact on the Indian Markets

In Brief: The April 2026 edition of Market Views examines the impact of the ongoing Iran-Israel-US war on energy prices and its implications for India. Drawing on a parallel from the Russia-Ukraine war of 2022, Hiren Ved, Director and CIO, Alchemy Capital Management, walks through crude oil price trajectories, the historical impact on corporate EBITDA margins, sectoral performance patterns during geopolitical crises, and India's Index of Industrial Production (IIP) data heading into this period of uncertainty.
Setting the Context: Six Weeks into the Iran-Israel-US War
As of the April 2026 Market Views, India and global markets are navigating the eighth week of the Iran-Israel-US war. One of the most direct and visible consequence of this conflict has been on energy prices, in our view. Crude oil prices spiked to approximately $120 per barrel and have since been hovering in the $100–$115 range.
A key structural factor distinguishing this crisis from previous ones is the conflict's geography. India imports approximately 20% of its crude oil through the Strait of Hormuz—a passage that is currently at the centre of the conflict zone and is largely controlled by Iran. While India-origin ships have been permitted to pass, energy costs have remained elevated across the board. Unlike in 2022, when India partially offset the impact of high global prices by accessing cheaper, sanctioned Russian crude, no such alternative is readily available in the current environment.
Drawing from the 2022 Playbook: Crude Price Movement During the Russia-Ukraine War
To contextualise the current situation, the April 2026 Market Views draws a parallel with the Russia-Ukraine war that began in February 2022. The comparison is instructive, not because every crisis unfolds identically, but because it provides a data-backed framework to assess the potential trajectory of energy prices and their downstream effects.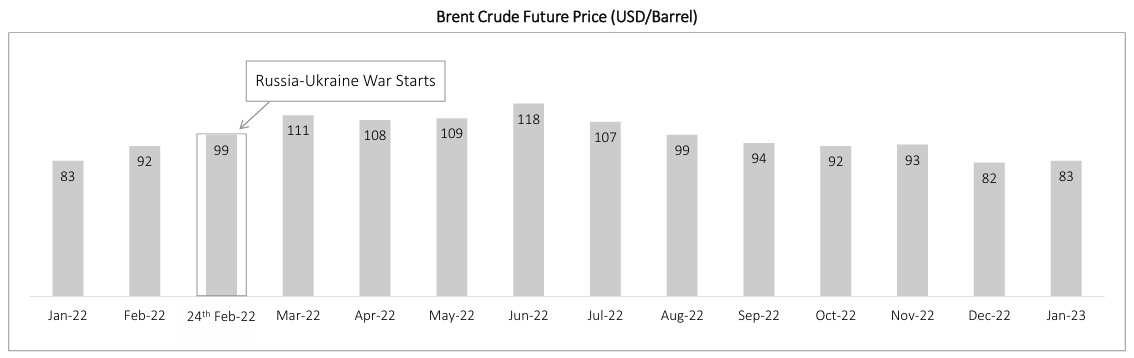
Source: https://www.investing.com/commodities/brent-oil
In January 2022, before the Russia-Ukraine war broke out, Brent crude averaged approximately $83 per barrel. On the day the war commenced (24th February 2022), prices spiked to $99. Crude then continued rising, reaching a peak of $118 in June 2022, roughly 4 to 5 months after the conflict began, before gradually cooling off in subsequent months.
The current situation shows notable similarities: a sharp spike to $120 in a single month, followed by a period of cooling. A key difference is that in 2022, elevated prices persisted for several months before normalising, while in the current conflict, the spike was more immediate. How long prices remain elevated will depend on how quickly the geopolitical situation gets resolved.
Margin Movement: What Higher Energy Costs Did to India Inc. in 2022
One of the most significant effect of elevated energy prices is their impact on corporate profitability. The April 2026 Market Views presents NSE 500 EBITDA margin cumulative data (for 406 Non-BFSI companies) from the Russia-Ukraine war period to illustrate this effect.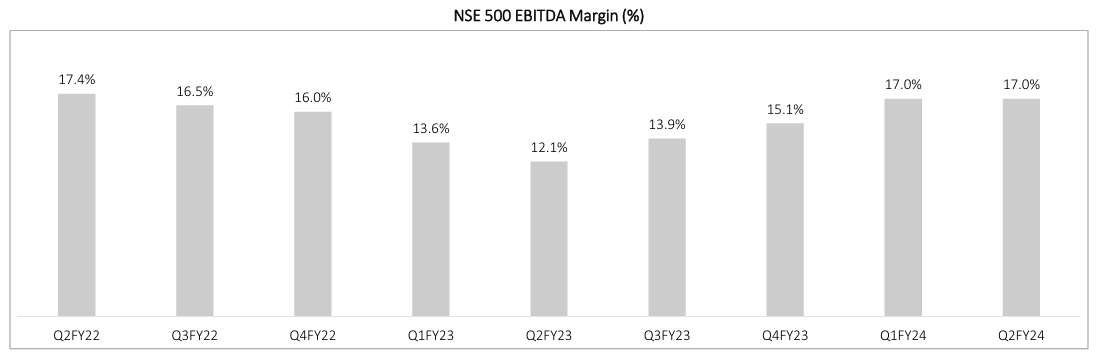
Source: Asian Markets Securities report "NIFTY 500 EARNINGS Analysis – 3Q FY26" released in March 2026
Recovery began in Q3FY23, with margins gradually rebuilding to 17% by Q1FY24. This means it took approximately three-quarters of the way for margins to return to pre-war levels.
A similar trajectory could play out this time, with Q4FY26 earnings likely to remain healthy given the war has only been ongoing for about two month, while the real earnings impact may be felt in subsequent quarters. Management commentary during Q4FY26 result announcements will be an important signal to watch.
Sectoral Performance: What History Shows About Relative Returns
Beyond the aggregate market impact, the April 2026 Market Views examines how different sectors of the Indian market performed during the Russia-Ukraine war — and compares this with what has happened in the initial weeks of the current conflict.
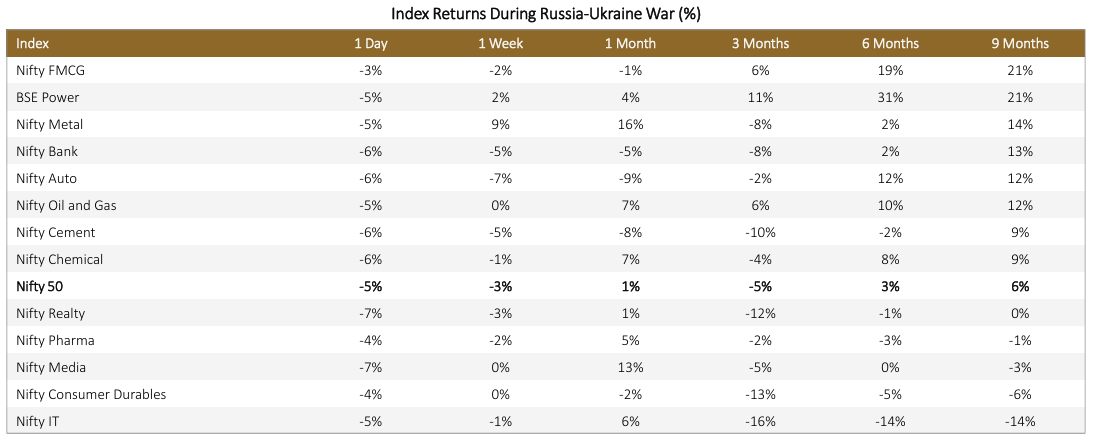
Index Returns During the Russia-Ukraine War (%)
Returns calculated from February 23, 2022 to November 23, 2022
Source: Nifty Indices Historical Data | BSE Index – Bloomberg
Nine months after the Russia-Ukraine war began, contributing sectors were FMCG (+21%), Power (+21%), Metals (+14%), Banks (+13%), Autos (+12%), and Oil & Gas (+12%) — all outperforming the Nifty 50's 9-month return of +6%. The laggards over the same period were IT (-14%), Consumer Durables (-6%), Media (-3%), and Pharma (-1%).
A key observation from this data is that sectors that suffered the most immediately after the war, including banks and autos, were among those that recovered over a 6–9month horizon, pointing to the classic pattern of knee-jerk reactions followed by fundamental-driven reversion.
Source: Nifty Indices Historical Data | BSE Index – Bloomberg
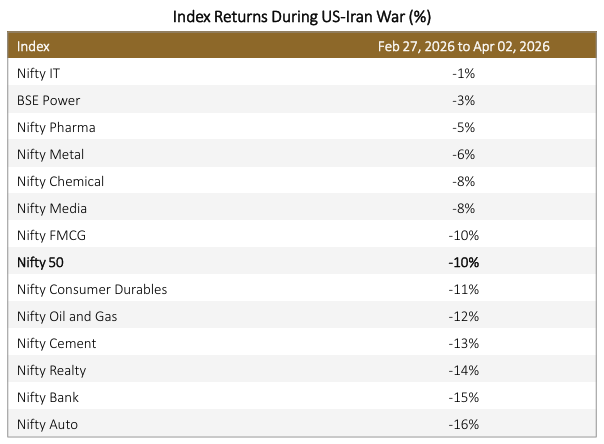
In the initial weeks of the current conflict (February 27 to April 2, 2026), the Nifty 50 declined approximately 10%. The pattern of relative outperformance and underperformance closely resembles that of 2022. IT (-1%) and Power (-3%) have held up relatively better, while Autos (-16%), Banks (-15%), Realty (-14%), and Cement (-13%) have seen sharper declines, consistent with the initial-impact dynamics observed in the Russia-Ukraine period.
India's Index of Industrial Production (IIP): A Recovery Interrupted?
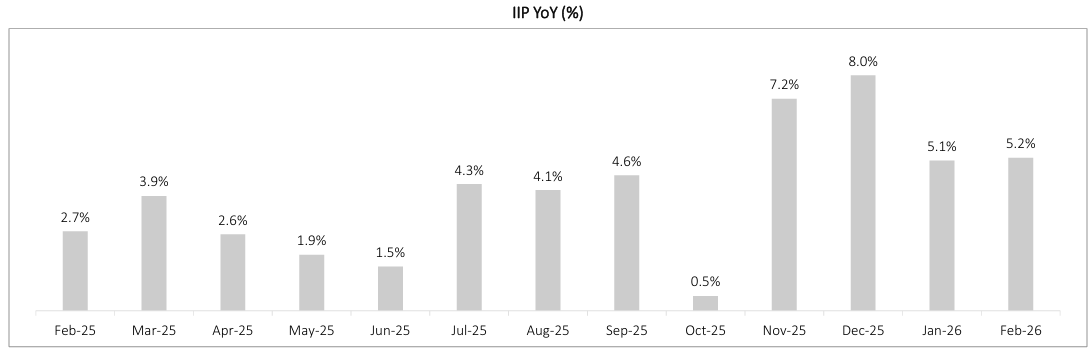
Before the geopolitical shock, India's macroeconomic recovery trajectory was gathering meaningful momentum. The April 2026 Market Views presents IIP data to underscore the strong base from which the economy now faces this disruption.
Source: https://www.pib.gov.in/PressReleaseDetail.aspx?PRID=2246871®=6&lang=1
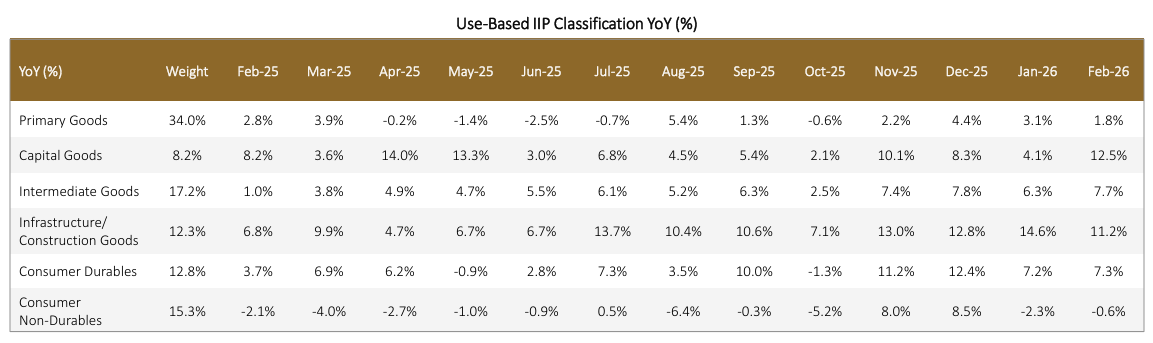
After hitting a low point in October 2025 (0.5%), IIP growth accelerated sharply to 7.2% in November 2025 and 8.0% in December 2025, before settling at a steady 5.1% and 5.2% in January and February 2026, respectively. Within this recovery, capital goods emerged as a standout, growing at 12.5% in February 2026, and infrastructure/construction goods grew at 11.2%, pointing to a strengthening investment cycle.
Source: https://www.pib.gov.in/PressReleaseDetail.aspx?PRID=2246871®=6&lang=1
The consistent momentum in capital goods and infrastructure/construction goods is particularly noteworthy, as it reflects strengthening investment activity, both public and private, that was well underway before the current geopolitical disruption.
Putting It Together: Data in Context
The April 2026 Market Views reinforces a recurring theme: Geopolitical crises create near-term uncertainty, but the data provides a framework for navigating it.
The Russia-Ukraine war analogy offers a usefulplaybook. Margins contracted for two quarters before companies adjusted to higher cost structures, and some were able to pass on costs to end customers. Sectors that faced the sharpest initial corrections often recovered over a 6–9 month horizon. And the underlying macroeconomic recovery, which was well underway in India, may have been disrupted but not necessarily derailed.
As emphasised in the video, the critical variable to monitor will be the duration of the conflict, and therefore, how long energy prices remain elevated. Q4FY26 earnings are expected to be healthy given the limited exposure to date, but management commentary on cost outlook and margin management will be closely watched, in our view. The eventual resolution of the conflict and its impact on crude prices will be the key determinant of how the corporate profitability picture unfolds from here.
Frequently Asked Questions (FAQs)
1. How does the current crude oil spike compare to the Russia-Ukraine war of 2022?
In 2022, Brent crude was at $83 before the war, spiked to $99 on 24th Feb 2022, the day of the outbreak, and peaked at $118 about four to five months later in June 2022. In the current situation, crude oil spiked to approximately $120 in a single month before cooling. A key difference is that India previously had access to cheaper Russian crude, which is not available as an alternative in the current scenario.
2. What was the impact on corporate India's EBITDA margins during the Russia-Ukraine war?
NSE 500 Non-BFSI EBITDA cumulative margins fell from 16% in Q4FY22 to 12.1% in Q2FY23—a contraction of nearly 400 basis points over two quarters. Recovery took approximately three quarters, with margins returning to 17% by Q1FY24.
3. Which Index outperformed the Nifty 50 over a 9-month horizon during the Russia-Ukraine war?
FMCG (+21%), Power (+21%), Metals (+14%), Banks (+13%), Autos (+12%), and Oil & Gas (+12%) all outperformed the Nifty 50's 9-month return of +6% following the Russia-Ukraine war.
4. What was India's IIP growth trajectory before the current geopolitical shock?
India's IIP growth had recovered strongly from a low of 0.5% in October 2025 to 7.2% in November 2025 and 8.0% in December 2025, before stabilising at 5.1% and 5.2% in January 2026 and February 2026, respectively, with capital goods and infrastructure/construction goods leading this recovery.
Disclaimers:
This blog is for informational purposes only and should not be considered an offer or solicitation to buy or sell any securities or make any investments. We recommend readers take independent advice before making any investment decisions. Please refer to our Disclaimer and Disclosures for more details.
General Risk Factors:
-
All products / investment approach attract various kinds of risks. Please read the relevant Disclosure Document/ Client Agreement/ Offer Documents (includes Private Placement Memorandum and Contribution Agreement) carefully before investing.
General Disclaimers:
-
The information and opinions contained in this report/ presentation have been obtained from sources believed to be reliable, but no representation or warranty, express or implied, is made that such information is accurate or complete.
-
Information and opinions contained in the report/ presentation are disseminated for the information of authorized recipients only and are not to be relied upon as advisory or authoritative or taken in substitution for the exercise of due diligence and judgement by any recipient.
-
The information and opinions are not, and should not be construed as, an offer or solicitation to buy or sell any securities or make any investments.
-
Nothing contained herein, including past performance, shall constitute any representation or warranty as to future performance.
-
The client is solely responsible for consulting his/her/its own independent advisors as to the legal, tax, accounting and related matters concerning investments and nothing in this document or in any communication shall constitutes such advice.
-
The client is expected to understand the risk factors associated with investment & act on the information solely on his/her/its own risk. As a condition for providing this information, the client agrees that Alchemy Capital Management Pvt. Ltd., its Group or affiliates makes no representation and shall have no liability in any way arising to them or any other entity for any loss or damage, direct or indirect, arising from the use of this information.
-
This document and its contents are proprietary information of Alchemy Capital Management Pvt. Ltd and may not be reproduced or otherwise disseminated in whole or in part without the written consent.
-
The information and opinions contained in this document may contain “forward-looking statements”, which can be identified by the use of forward-looking terminology such as “may”, “will”, “seek”, “should”, “expect”, “anticipate”, “project”, “estimate”, “intend”, “continue” or “believe” or the negatives thereof or other variations thereon or comparable terminology. Due to various risks and uncertainties, including those set forth under the Disclosure Document/Offer Documents, actual events or results or the actual performance may differ materially from those reflected or contemplated in such forward-looking statements.
Regulatory Disclosures:
-
All clients have an option to invest in the above products / investment approach directly, without intermediation of persons engaged in distribution services.
-
This document, its contents, especially the Performance related information, is not verified by SEBI or any regulator.