India's Economic Pulse - January 2026: What the Data Shows

As India enters 2026, expectations around economic recovery remain closely tied to the impact of recent fiscal and tax reforms. Over the past year, policy measures such as income tax cuts and GST rate rationalisation have been positioned as catalysts for a consumption-led revival.
This blog, based on Alchemy Capital’s January 2026 Market Views, presents a structured, data-led review of the indicators to assess whether early signs of a revival are visible across industrial activity, consumption, investment, and government finances.
Industrial Activity: Early Signs of Revival
Index of Industrial Production (IIP)
The Index of Industrial Production (IIP) provides a timely snapshot of industrial momentum. Recent data indicate a meaningful improvement.
IIP – General (Year-on-Year Growth %)
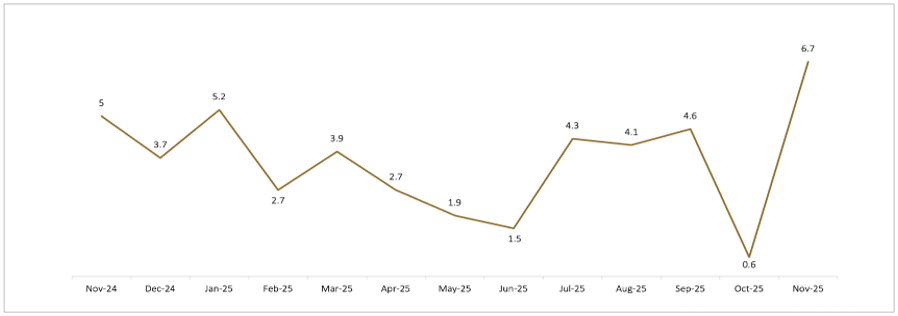
Source: PL Capital
Note: Data as on January 06, 2026
In November 2025, IIP growth accelerated to 6.7% YoY, the highest reading in the last twelve months. This improvement marks a notable inflection following a period of subdued momentum during mid-2025.
Manufacturing Performance Within IIP
Manufacturing, the most significant component of IIP, recorded a year-on-year growth of 8% in November 2025, also a twelve-month high. This pickup in manufacturing output plays a central role in supporting broader industrial recovery.
General Classifiaction of IIP (YoY Growth %)
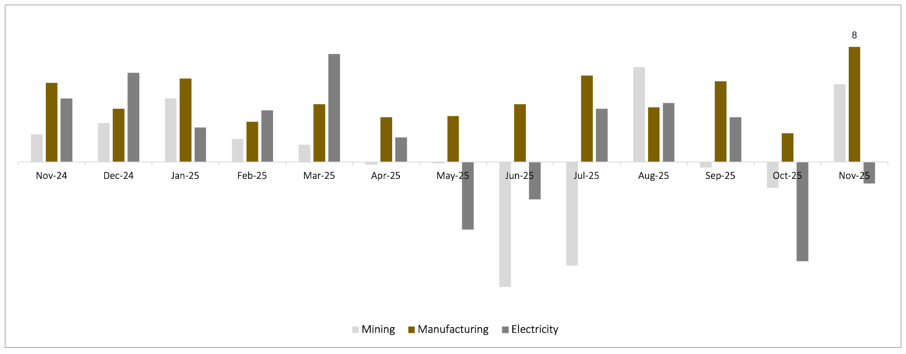
Source: PL Capital
Note: Data as on January 06, 2026
Power Demand: Corroborating Industrial Momentum
Power demand is often used as a proxy for underlying economic activity, given its close linkage with industrial production and consumption.
After registering a marginal contraction of approximately -1% in November 2025, power demand rebounded sharply in December 2025, growing 6.4% year-on-year. As highlighted in the video, part of this recovery reflects improved manufacturing activity, while seasonal factors, such as colder weather, also contributed to higher electricity usage.
Note: Data as on January 06, 2026
The rebound in power demand, following several months of tepid growth, reinforces the improving trend seen in industrial data.
Use-Based Classification of IIP: Breadth of Recovery
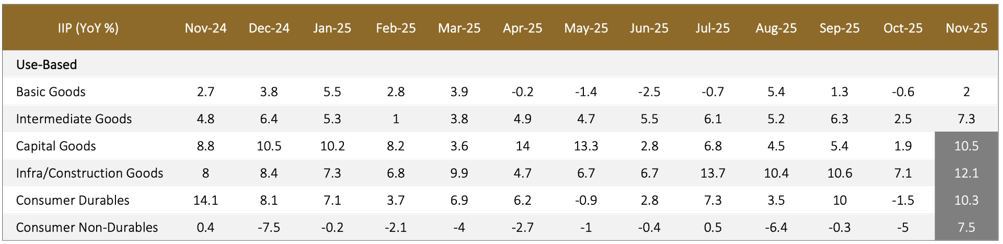
Source: PL Capital
Note: Data as on January 06, 2026
Beyond headline IIP figures, use-based classification offers insight into the composition of industrial growth.
Use-Based IIP Growth (YoY %)
Four of the six use-based categories are currently operating at multi-month or cycle highs.
Key observations include:
-
Consumer Durables growth of 10.3%, marking a twelve-month high, rebounding from a contraction of -1.5% in October 2025, driven by GST rate rationalisation on electronics and robust performance in motor vehicles.
-
Consumer Non-Durables, often used as a proxy for FMCG demand, expanded 7.5%, driven by post-festive restocking and a 10.5% expansion in the pharmaceutical industry.
-
Capital Goods recorded 10.5% growth, a six-month high, reflecting rising private and public investment, expansion of manufacturing, and successful PLI schemes.
-
Infrastructure & Construction Goods grew 12.1%, the strongest among all use-based segments. This is fuelled by post-monsoon construction acceleration and the government’s INR 11.2 lakh crore infrastructure spending push.
These trends suggest that the recovery is not limited to a single segment but is becoming increasingly broad-based.
Central Government Capital Expenditure: Frontloaded but Monitored
Government capital expenditure (capex) remains a critical pillar of economic activity.
Central Government Capex Snapshot (FY26)
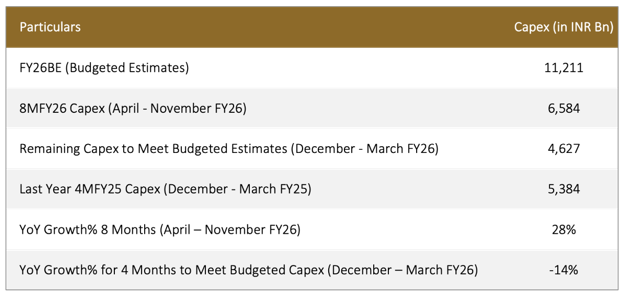
Source: AMSEC, data as of January 06, 2026
The government budgeted ₹11.2 trillion for capex in FY26, of which approximately ₹6.6 trillion has already been spent in the first eight months. This reflects a strategy of frontloading expenditure earlier in the fiscal year.
While capex spending in November 2025 was around 14% lower year-on-year, the arithmetic presented indicates that even if spending over the remaining four months runs at a similar pace, the full-year budgeted target remains achievable.
This remains an area that will be closely monitored, particularly in the context of fiscal balances.
GST Collections: A Divergence to Watch
While most indicators show improvement, GST collections present a more mixed picture.
Monthly Gross GST Collections
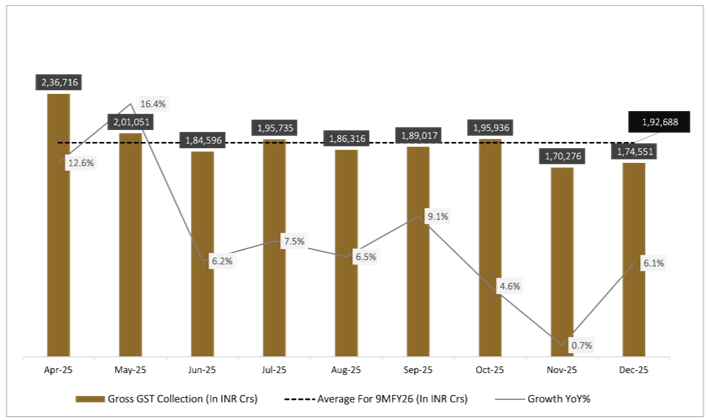
Source: www.gst.gov.in, data as of January 06, 2026
GST growth moderated from double-digit levels in April’25 and May’25 to single-digit growth in subsequent months. In December’25, GST collections grew by approximately 6% year-on-year.
Importantly, as highlighted in the video, much of this growth was driven by customs and import duties, while excise duty growth remained subdued at around 1%. This divergence has raised concerns among policymakers and market participants, particularly regarding potential implications for future government spending.
Automobile Sales: Post-GST Acceleration Across Segments
Automobile sales data provide a bottom-up confirmation of improving consumption trends following GST rationalisation.
Automobile Sales Growth Comparison (YoY %)
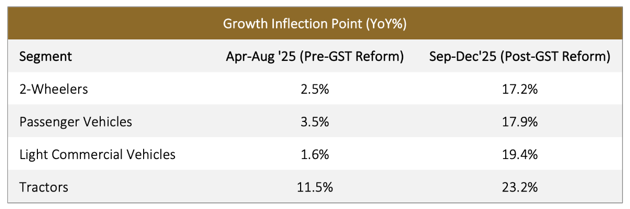
Source: Elara Capital, Data as of January 06, 2026
All major vehicle segments witnessed a sharp acceleration in growth post-September’25, moving from low single-digit growth to substantial double-digit expansion.
Banking Business Update
The banking sector continues to show steady momentum, reflecting improving credit demand and broader economic activity.
Based on quarterly business updates disclosed up to January 06, 2026, aggregate loan growth across a broad set of banks stood at approximately 12% year-on-year as of December 2025, with sequential growth of around 4% quarter-on-quarter. This growth was evident across private-sector banks, public-sector banks, and select small finance banks.
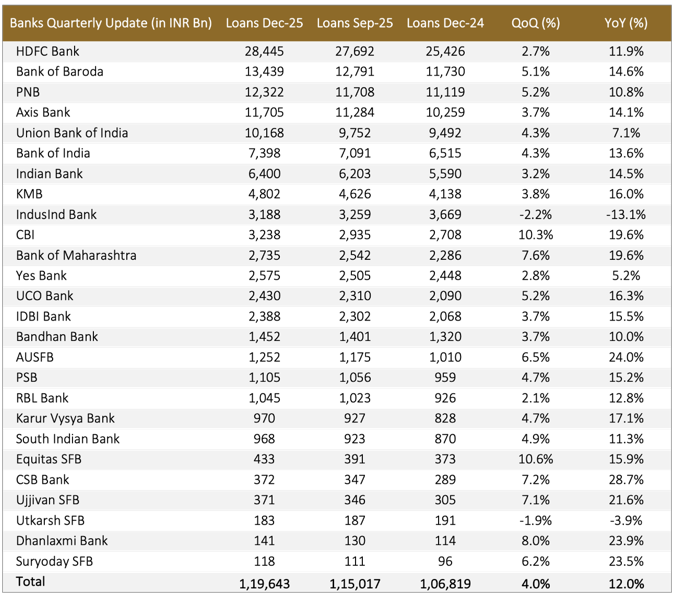
Source: Philip Capital
Note: Only those companies that have disclosed business updates as of January 06, 2026 have been considered.
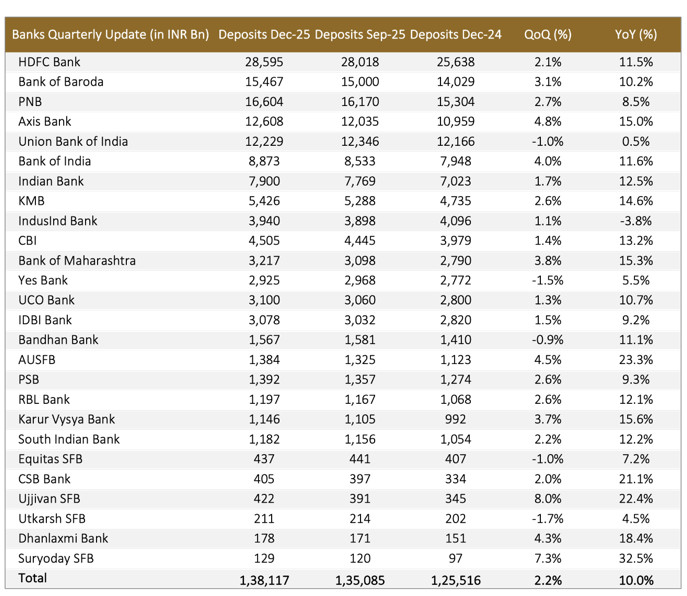
Source: Philip Capital
Note: Only those companies that have disclosed business updates as of January 06, 2026 have been considered.
Alongside credit growth, banks also reported steady growth in deposits during the quarter. Aggregate deposits across the same set of banks grew by approximately 10% year-on-year, with low single-digit quarter-on-quarter growth. As highlighted, deposit growth continues to trail loan growth, reflecting the prevailing liquidity environment, but remains broad-based across the banking system.
Overall, the banking data presented indicates that both credit and deposit trends have normalised to early double-digit levels, aligning with patterns observed across other consumption and investment indicators discussed in the video.
Retail and NBFC Business Updates
Retail Q3 FY26 Business Performance
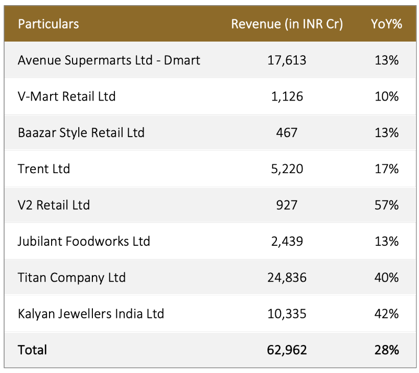
Source: Company Filings, BSE
Note: Only those companies that have disclosed business updates as of January 06, 2026 have been considered.
Jewellery retailers emerged as standout performers, supported by elevated gold prices and a strong wedding season.
NBFC Q3FY26 Business Update
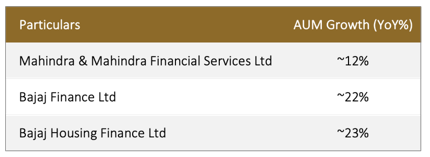
Source: Company Filings, BSE
Credit growth across banks and NBFCs has revived to early-teen levels, indicating improving demand for credit.
Summary: Data-Led Signals at the Start of 2026
Taken together, the data discussed in the January 2026 monthly update point to improving industrial momentum, recovering consumption indicators, and sustained investment activity, supported by frontloaded government capex.
However, as reiterated in the video, GST collections remain the key variable to monitor going forward. As Hiren Ved notes, while most indicators suggest improvement, “this is something that we will monitor and talk about in our subsequent monthly videos.”
This measured, evidence-based approach remains central to evaluating India’s evolving economic landscape as the year progresses.
Frequently Asked Questions (FAQs)
1. What does the latest IIP data indicate about India’s industrial activity?
The latest Index of Industrial Production (IIP) data shows a 6.7% year-on-year growth in November 2025, the highest recorded in the past 12 months. Manufacturing output grew by 8% YoY, also a 12-month high, indicating a clear improvement in industrial activity compared to earlier months in the year.
2. Which sectors are driving the recent improvement in industrial growth?
Based on use-based IIP classification, the recovery is being led by consumer durables (10.3%), consumer non-durables (7.5%), capital goods (10.5%), and infrastructure & construction goods (12.1%). Notably, consumer non-durables recorded their first meaningful pickup after nearly 25 months, while capital goods and infrastructure reflect strengthening investment activity.
3. Why are GST collections being closely monitored despite improving economic indicators?
Although most high-frequency indicators, such as IIP, power demand, auto sales, and credit growth, show improvement, GST collections have moderated to single-digit growth in recent months. December’25 GST collections grew by around 6% YoY, with most of the increase driven by import duties, while excise duty growth remained essentially flat. This divergence makes GST collections a critical data point to monitor going forward.
Disclaimers:
This blog is for informational purposes only and should not be considered an offer or solicitation to buy or sell any securities or make any investments. We recommend readers take independent advice before making any investment decisions. Please refer to our Disclaimer and Disclosures for more details.
General Risk Factors:
-
All products / investment approach attract various kinds of risks. Please read the relevant Disclosure Document/ Client Agreement/ Offer Documents (includes Private Placement Memorandum and Contribution Agreement) carefully before investing.
General Disclaimers:
-
The information and opinions contained in this report/ presentation have been obtained from sources believed to be reliable, but no representation or warranty, express or implied, is made that such information is accurate or complete.
-
Information and opinions contained in the report/ presentation are disseminated for the information of authorized recipients only and are not to be relied upon as advisory or authoritative or taken in substitution for the exercise of due diligence and judgement by any recipient.
-
The information and opinions are not, and should not be construed as, an offer or solicitation to buy or sell any securities or make any investments.
-
Nothing contained herein, including past performance, shall constitute any representation or warranty as to future performance.
-
The client is solely responsible for consulting his/her/its own independent advisors as to the legal, tax, accounting and related matters concerning investments and nothing in this document or in any communication shall constitutes such advice.
-
The client is expected to understand the risk factors associated with investment & act on the information solely on his/her/its own risk. As a condition for providing this information, the client agrees that Alchemy Capital Management Pvt. Ltd., its Group or affiliates makes no representation and shall have no liability in any way arising to them or any other entity for any loss or damage, direct or indirect, arising from the use of this information.
-
This document and its contents are proprietary information of Alchemy Capital Management Pvt. Ltd and may not be reproduced or otherwise disseminated in whole or in part without the written consent.
-
The information and opinions contained in this document may contain “forward-looking statements”, which can be identified by the use of forward-looking terminology such as “may”, “will”, “seek”, “should”, “expect”, “anticipate”, “project”, “estimate”, “intend”, “continue” or “believe” or the negatives thereof or other variations thereon or comparable terminology. Due to various risks and uncertainties, including those set forth under the Disclosure Document/Offer Documents, actual events or results or the actual performance may differ materially from those reflected or contemplated in such forward-looking statements.
Regulatory Disclosures:
-
All clients have an option to invest in the above products / investment approach directly, without intermediation of persons engaged in distribution services.
-
This document, its contents, especially the Performance related information, is not verified by SEBI or any regulator.