March 2026 Market Views: The Iran-Israel War, Energy Risks, and What FY2026 Told Us About Indian Markets

In Brief: The March 2026 edition of Market Views focuses on two distinct themes. The first is the Iran-Israel war and its potential impact on global energy flows, particularly through the Strait of Hormuz, and what history suggests about how Indian equities respond to crude oil shocks. The second is a sectoral review of NSE 500 returns for FY2026, examining which sectors drove performance and which were laggards, and the underlying reasons for each. The discussion, led by Hiren Ved, Director and CIO at Alchemy Capital Management, is grounded in data and historical context.
Setting the Context: Two Themes Closing FY2026
As India approached the end of the Financial Year 2026, two issues demanded attention: a new geopolitical flashpoint in the form of the Iran-Israel war, and the question of how the domestic market had actually performed over the year at a sectoral level.
In the March 2026 Market Views, Hiren Ved examined both with the same data-led lens that has guided the series across prior months—contextualising near-term noise within longer-term structural and historical frameworks.
The Iran-Israel War: What It Means for India's Energy Imports
Why the Strait of Hormuz Matters
Wars, by their nature, disrupt the global economy and financial markets. The Iran-Israel conflict carries particular significance for India and Asia more broadly because of its potential to disrupt energy flows through the Strait of Hormuz (SoH), one of the world's most critical maritime passages.
The Strait of Hormuz accounted for approximately 27% of global maritime crude oil trade as of early CY2025. Total flows through the strait stood at around 20 million barrels per day (mb/d) — comprising roughly 14.2 mb/d of crude oil and condensates and 5.9 mb/d of petroleum products.
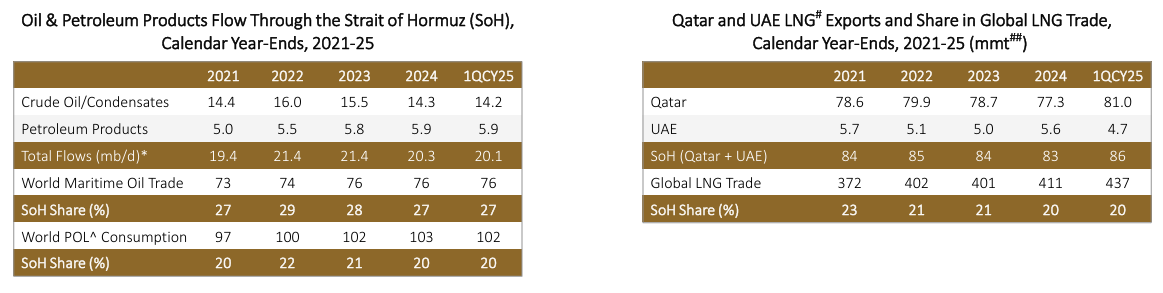
Source: Kotak Institutinal Equities report ‘Oil, Gas & Consumable Fuels' dated March 04, 2026
Note: *mb/d - Million Barrels Per Day, ^POL - Petroleum, Oil, and Lubricants, #LNG - Liquefied Natural Gas, ##mmt - Million Metric Tons
For LNG (Liquefied Natural Gas) specifically, Qatar and the UAE together account for approximately 86 million metric tons of LNG exports that transit through the SoH — representing around 20% of global LNG trade.
Any sustained disruption to the free movement of vessels through the Strait of Hormuz, therefore, has consequences well beyond oil prices alone. For example, insurance cover for tankers operating in the region has already been suspended by several major underwriters, adding a further layer of complexity to the free flow of energy trade.
Asia and India: Most Exposed
The data make clear that the countries with the most to lose from a prolonged disruption are in Asia. Of the total oil exports that transit through the Strait of Hormuz, over 80% is destined for Asian economies, with China, India, South Korea, and Japan as the primary destinations.
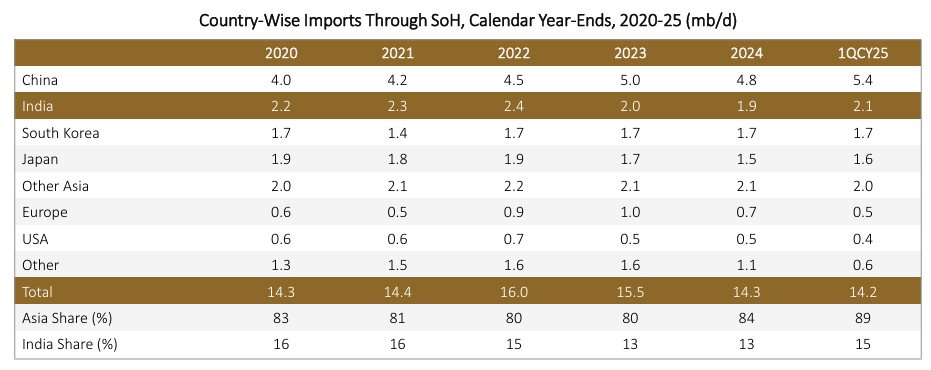
Source: Kotak Institutional Equities report 'Oil, Gas & Consumable Fuels' dated March 04, 2026
India's share of oil transiting the SoH stood at approximately 15% in 1QCY2025. The consequence is straightforward: the faster the resolution of the conflict and the restoration of free passage, the lower the medium-term impact on India's energy import costs and the broader economy.
At the time of recording on March 11, 2026, oil prices had spiked to nearly $120 per barrel before cooling off, as the US indicated the conclusion of its military objectives and the G7 countries coordinated a release from their strategic petroleum reserves. However, as Hiren noted, until the SoH itself is reliably open to normal energy trade, residual risks remain.
Historical Evidence: How Indian Equities Have Responded to Crude Shocks
Correlation Between Crude and Nifty 50
One of the more reassuring observations from the data is that India's sensitivity to oil price movements has declined significantly over time, even as the country remains a major crude importer.
Based on data from the Axis Capital 'India Strategy' report dated March 04, 2026, the correlation between the Nifty 50 index and crude oil prices has evolved as follows:
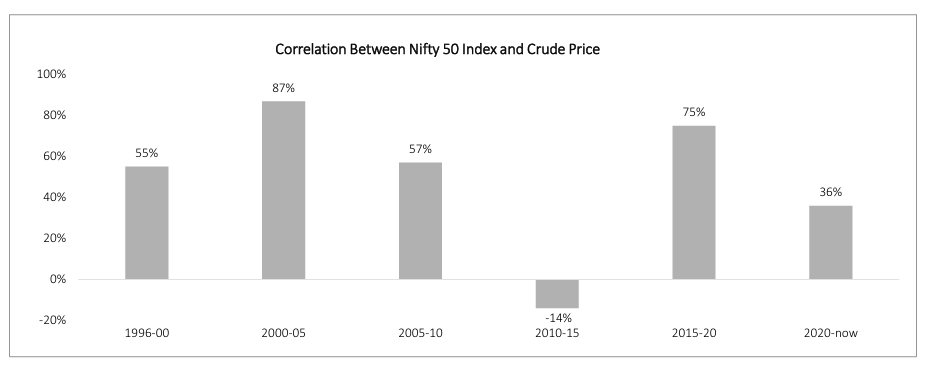
Source: Axis Capital report 'India Strategy' dated March 04, 2026
The post-2020 reading of 0.36 is the lowest recorded across any comparable period. The interpretation offered is that as India's economy has grown in scale, sophistication, and sectoral diversification, the stock market's dependence on crude oil price movements has been structurally diminishing, in our view.
What Happens to Nifty 50 After a Sharp Crude Spike?
Beyond the long-run correlation, the data examined 16 instances since 1999 in which crude oil prices spiked by more than 20% within a single month and tracked Nifty 50 returns in the one-month and three-month periods that followed.
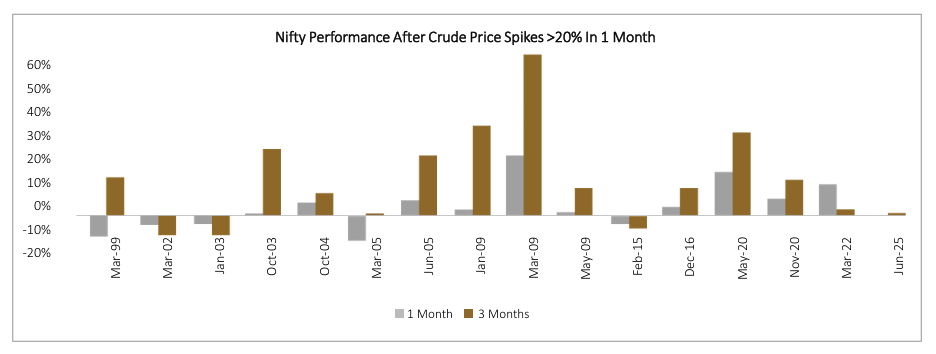
Source: Axis Capital report 'India Strategy' dated March 04, 2026
The key finding: in 13 of those 16 instances, subsequent three-month Nifty returns were positive. Negative reactions were limited to three specific instances—March 2002, January 2003, and February 2015.
The implication is that most crude oil spikes, when examined historically, tend to be short-lived. Once prices recede, the data suggests that markets have typically recovered, and in many cases, delivered meaningful positive returns in the months following the spike. Hiren expects this episode to also follow the pattern of most historical precedents.
FY2026 Sectoral Review: What the NSE 500 Tells Us
The Overall Picture
Looking at NSE 500 performance from April 1, 2025, to March 9, 2026, the index delivered a total return of approximately 10%. Within that aggregate, however, the distribution of contributions was highly concentrated, and the divergence between Contributors and laggards is instructive.
The full sectoral breakdown, based on market capitalisation-weighted methodology, is as follows:
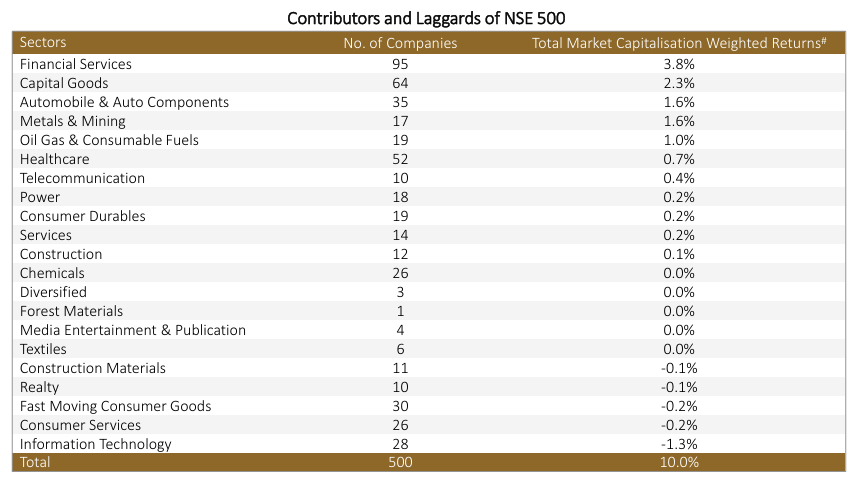
Source: Alchemy Capital | Note: Returns calculated from April 1, 2025, to March 9, 2026. Industry classification as per NSE Indices.
The top four sectors, Financial Services, Capital Goods, Automobiles & Auto Components, and Metals & Mining, together accounted for over 80% of the index's 10% return.
The Top Performers: What Drove Them
Financial Services: Led by NBFCs, PSU Banks, and Exchanges
Financial Services was the single largest contributor at 3.8%, but the composition of that performance was notable. Contrary to common assumption, the gains were driven primarily by NBFCs, public sector banks, and non-lending businesses such as stock exchanges—rather than private sector banks, which were actually detractors within the sector during this period.
Capital Goods: Power T&D (transmission and distribution) and Defence in Focus
Capital Goods contributed 2.3% to the index return. The outperformance was concentrated in two specific subsegments: power T&D companies and select defence names.
Power T&D companies benefited from two simultaneous tailwinds—significant domestic capex on transmission infrastructure within India, and the global AI-driven surge in data centre investment, which has increased demand for electrical infrastructure and components. Several of these companies have also expanded into export markets, diversifying their revenue base.
Defence outperformance was more straightforward: the global geopolitical backdrop, multiple active conflicts and an accelerating strategic ramp-up in defence budgets across nations have supported sustained re-rating of companies with exposure to indigenisation and domestic defence supply chains.
Automobiles & Auto Components: GST the Key Catalyst
The auto sector's contribution of 1.6% to index returns was largely driven by GST rate cuts, which benefited both OEMs (Original Equipment Manufacturers) and auto ancillary manufacturers. EV-related companies were relatively weaker performers within the sector.
Metals & Mining: A Tale of Two Sub-Segments
Metals & Mining also contributed 1.6%. Within this, non-ferrous and precious metals companies significantly outperformed, while ferrous metals and recyclers were comparatively weaker.
The Laggards: Context Behind the Underperformance
IT Services: A Structural Concern Overlaid on Cyclical Weakness
Information Technology was the most significant detractor, pulling back index returns by approximately 1.3%. Growth in the sector had already been running at low single digits. The additional overhang comes from genuine uncertainty about AI's potential to compress both revenues and addressable opportunity in large parts of the traditional IT services business model. As Hiren noted, only time will tell how AI will ultimately interact with the sector, but for now, the market is pricing in meaningful risk.
Consumer Services: Divergence Within the Sector
Consumer Services detracted 0.2% overall. The underperformance was concentrated in large apparel retailers, where growth has moderated. Within the same sector, however, a few new-age platform companies outperformed, highlighting the bifurcation within what appears, at the headline level, to be a uniform laggard.
FMCG: Volume Growth Remains the Persistent Challenge
FMCG was a marginal detractor, down 0.2%. Volume growth has remained a structural challenge for the sector, though some companies have shown incremental improvement following GST rate cuts.
Realty: Pre-Sales Moderation and Negative Sentiment
Real estate also detracted marginally, reflecting a slowdown in pre-sales activity and an overhang of negative sentiment from broader sectoral concerns.
It is worth noting that among the four underperforming sectors, only IT was a meaningful detractor. Consumer Services, FMCG, and Realty each contributed a negative 0.1–0.2%, which, while directionally unfavourable, were relatively contained in magnitude.
Putting It All Together: Data Over Reaction
The March 2026 Market Views reinforced two themes that have been consistent across the series: that near-term disruptions, whether geopolitical or market-related, need to be assessed against historical data rather than reacted to in isolation; and that sectoral performance, when examined in detail, reveals nuance that headline index returns tend to obscure.
On the geopolitical front, the key watchpoint remains the Strait of Hormuz. A swift resolution that restores normal energy flows would significantly contain India's exposure. History suggests India's equity markets have shown resilience following crude oil shocks, but the outcome will depend on the duration and depth of the disruption, in our view.
On the sectoral front, FY2026 was a year where financial services, infrastructure-adjacent capital goods, autos, and metals led. As Hiren observed, sectors that did not perform well this year may represent interesting opportunities in the periods ahead, though that assessment, as always, requires continued monitoring of what the data signals.
Frequently Asked Questions (FAQs)
1. Why is the Iran-Israel war particularly significant for India's economy?
India imports a substantial share of its crude oil and LNG, much of which transits through the Strait of Hormuz. As per data presented in the March 2026 Market Views, approximately 27% of global maritime crude oil trade passes through the strait, and India accounts for around 15% of the oil flows through it. Any prolonged disruption to the strait, whether through price spikes or physical restrictions on tanker movement, directly affects India's energy import costs and, by extension, its current account and inflation dynamics.
2. Has India's stock market historically fallen sharply after crude oil price spikes?
Historical data analysed across 16 instances since 1999, in which crude prices rose by more than 20% in a single month, shows that Nifty 50 returns in the subsequent one- and three-month periods were positive in 13 of those cases. The data also shows that the correlation between Nifty 50 and crude oil prices has fallen to approximately 0.36 in the post-2020 period, the lowest recorded across any comparable time window, suggesting India's equity market has become structurally less sensitive to oil price movements, in our view.
3. Which sectors drove NSE 500 returns in FY2026?
From April 1, 2025, to March 9, 2026, the NSE 500 delivered a total return of approximately 10%. Financial Services (3.8%), Capital Goods (2.3%), Automobiles & Auto Components (1.6%), and Metals & Mining (1.6%) were the top four contributors, together accounting for more than 80% of the index's total return.
4. What caused IT services to underperform in FY2026?
IT services were the largest sectoral detractor, reducing NSE 500 returns by approximately 1.3%. Growth was already subdued at low single digits. The additional factor is AI-related uncertainty, specifically, concerns about the potential for artificial intelligence to erode revenues and compress the addressable opportunity in traditional IT outsourcing and services. The market has priced in meaningful risk on this front, even as the final structural outcome remains uncertain.
5. Within Financial Services, which sub-segments actually led the performance?
Contrary to common assumptions, the outperformance in Financial Services during FY2026 was driven by NBFCs, PSU banks, and exchanges. Private sector banks were relatively weaker performers and, in fact, detractors from the sector's overall contribution.
Disclaimers:
This blog is for informational purposes only and should not be considered an offer or solicitation to buy or sell any securities or make any investments. We recommend readers take independent advice before making any investment decisions. Please refer to our Disclaimer and Disclosures for more details.
General Risk Factors:
-
All products / investment approach attract various kinds of risks. Please read the relevant Disclosure Document/ Client Agreement/ Offer Documents (includes Private Placement Memorandum and Contribution Agreement) carefully before investing.
General Disclaimers:
-
The information and opinions contained in this report/ presentation have been obtained from sources believed to be reliable, but no representation or warranty, express or implied, is made that such information is accurate or complete.
-
Information and opinions contained in the report/ presentation are disseminated for the information of authorized recipients only and are not to be relied upon as advisory or authoritative or taken in substitution for the exercise of due diligence and judgement by any recipient.
-
The information and opinions are not, and should not be construed as, an offer or solicitation to buy or sell any securities or make any investments.
-
Nothing contained herein, including past performance, shall constitute any representation or warranty as to future performance.
-
The client is solely responsible for consulting his/her/its own independent advisors as to the legal, tax, accounting and related matters concerning investments and nothing in this document or in any communication shall constitutes such advice.
-
The client is expected to understand the risk factors associated with investment & act on the information solely on his/her/its own risk. As a condition for providing this information, the client agrees that Alchemy Capital Management Pvt. Ltd., its Group or affiliates makes no representation and shall have no liability in any way arising to them or any other entity for any loss or damage, direct or indirect, arising from the use of this information.
-
This document and its contents are proprietary information of Alchemy Capital Management Pvt. Ltd and may not be reproduced or otherwise disseminated in whole or in part without the written consent.
-
The information and opinions contained in this document may contain “forward-looking statements”, which can be identified by the use of forward-looking terminology such as “may”, “will”, “seek”, “should”, “expect”, “anticipate”, “project”, “estimate”, “intend”, “continue” or “believe” or the negatives thereof or other variations thereon or comparable terminology. Due to various risks and uncertainties, including those set forth under the Disclosure Document/Offer Documents, actual events or results or the actual performance may differ materially from those reflected or contemplated in such forward-looking statements.
Regulatory Disclosures:
-
All clients have an option to invest in the above products / investment approach directly, without intermediation of persons engaged in distribution services.
-
This document, its contents, especially the Performance related information, is not verified by SEBI or any regulator.